LaurenandLloyd.com
where our wasted time becomes your wasted time
Teachers get invited to a fair number of graduation parties, and for years I’ve told myself that graduation “season” would be easier if I had a map of where the parties were. Last year I got organized and made a map. It was surprisingly easy. This should work with any sort of address data, so if you’re making maps for graduations or garage sales this should still work.
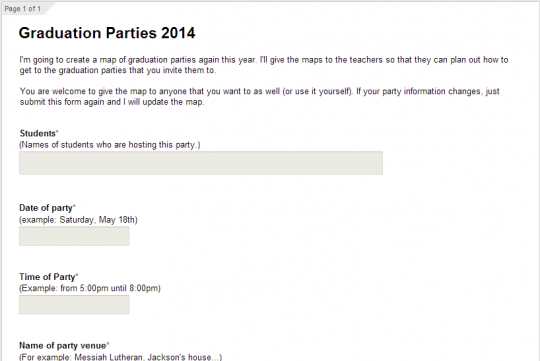
Step one: Trick Seniors into Getting you Graduation Information
The trick here is to make it easy for them to do so. I created a Google form to capture the data, but you could use any survey type site. We get the seniors to setup a Facebook Group each year, so I recruited a senior, convinced him that having a map of graduation parties would be a good idea (the seniors can use it too). He posted the form to the Facebook group and harassed seniors until we had all of the information.
Step two: Fix the data
Part of fixing the data will be standardizing all of the information that the seniors submitted so that everything is consistent (dates, times…). The rest is simply arranging the data in the correct order for the mapping service and sorting it by date and time. This is the order that I found makes a nice map. The order of the first 4 is mandated by the mapping software.
| Address | City | State | Zipcode | Name | Date | Time | Venue | Notes |
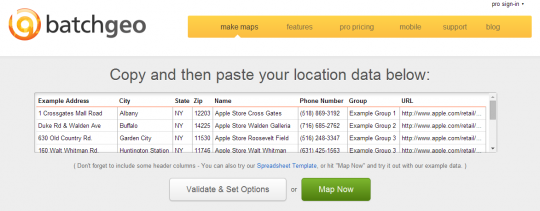
Step three: Paste your spreadsheet data into BatchGeo
BatchGeo is free as long as you have reasonably small sets of data. If you have hundreds of graduation parties you can still use it, but you’ll have to pay for the maps.
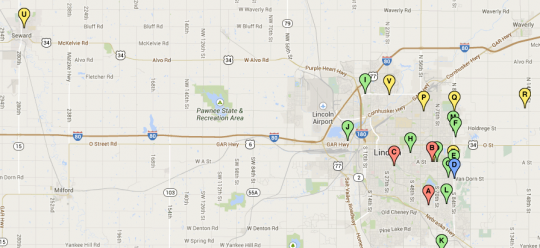
The image above links to the actual map, but batchgeo only keeps your map until people stop visiting it. After that, they will send you an email and you can visit it if you want to keep it.
Notice that you can filter by day and that the markers are labeled in alphabetical order by when the party gets started (assuming you sorted your data by date and time before you pasted it in).
Step four: Share your map
Just one note about sharing your map: if you make changes later, batchgeo generates a new URL for the edited version of your map. So if you make a change, make sure you send out the new URL to teachers and seniors. For that same reason, you probably don’t want to use URL shortening services like bit.ly that do not allow you to update the URL after the shortened link is created. Oh, it might also be polite to tell both the seniors and the teachers that just because you’re providing a map to the parties doesn’t imply that everyone is automatically invited to every party.
There are several good sources for general zombie preparedness information. But they all seem to report on the likelihood of a universal of zombie outbreak. If you’re trying to guarantee the survival of yourself and your family, or planning a vacation, you’ll want to know what the zombie threat level is on a state by state basis.
Yesterday we had the data in a handy table. Nice, but who wants to take that kind of time? Today we have the same information culled from state by state news reports, blog posts and tweets. Click on a state for more specific data.
Technical Details: a python script grabs the state by state data from google and twitter then saves an xml file that the flash map (from the lovely people at amMap) displays.
You might also be interested in these fine people:
Happy Father’s Day, Dad and Dad!
National Geographic suggested that this map shows that Hawaii is the happiest state, but I think it clearly shows that Nebraska is, if not the happiest, at least the least sad.

I attribute this mostly to the fact that we have more of a representational democracy than the rest of you guys (except for Maine).
Thanks to the mommies and sundry preschool personnel, I am given to understand that Dora’s schtick is using a map with the assistance of her damn dirty ape. Maps have been on my mind lately, too.


So this guy setup a webpage where you say what region, state, city (and so forth) of the country you most identify with and he turned that data into maps. I like maps of all sorts anyway, so I thought this was interesting. In addition to maps of regions, he also does maps of MLB, NFL, NBA, NHL and NCAA teams.